Results first quarter 2024

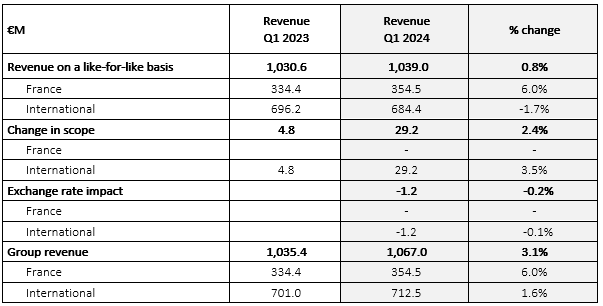
- FIRST QUARTER 2024 RESULTS: +3.1%
- Organic growth slowdown: +0.8%
- 1 acquisition overseas

EARNINGS AT THE END OF MARCH 2024: +3.1%
Alten’s full-year 2023 revenue increased 3.1%: with 6.0% growth in France and 1.6% overseas. On a like‐for‐like basis and at constant exchange rates, revenue grew by 0.8% (6.0% in France and -1.7% overseas).
Performance was hampered by unfavourable seasonal effects compared to Q1 2023 (-0.9 fewer working days).
The Defence & Security, Civil Aeronautics, Automotive and Railways sectors continued to grow at a satisfactory pace.
The trend observed in H2 2023 continued into Q1 2024, with a further slowdown in activity: France, Southern Europe and Asia posted satisfactory organic growth. However, Northern Europe, Eastern Europe and North America recorded negative growth.
External growth: 1 acquisition overseas
In Asia (Vietnam/Japan): one company specialising in software development. (annual revenue: €20m, 950 consultants)
OUTLOOK FOR 2024
The first half of 2024 will confirm the slowdown observed since mid-2023 before a likely improvement starting from September/October 2024.
Despite an unfavourable macroeconomic environment, notably in Europe, ALTEN’s organic growth should remain satisfactory at around 3% in 2024.
NEXT PUBLICATION: 25th July 2024
Q2 2024 Revenue:Date of Press Release: 25 July 2024 (market close)
About ALTEN
For more information: www.alten.com/investisseurs / Press contacts: alten@hopscotch.fr
As a European Leader in Engineering and Technology Consulting (ETC), Alten carries out design and research projects for the Technical and IT divisions of major clients in industry, telecoms and services. Alten’s stock is listed in compartment A of the Euronext Paris market (ISIN FR000001946); it is part of the SBF 120, the IT CAC 50 index and MIDCAP100, and is eligible for the Deferred Settlement Service (SRD).
Appendix to Press Release:
Definition of alternative performance indicators and reconciliation with IFRS
The Alten Group uses alternative performance indicators selected specifically to track its operational activities. The Group has chosen these indicators as they offer additional information, allowing the users of periodic financial information to have a comprehensive understanding of the Group’s performance. These alternative performance indicators are complementary to IFRS.
Revenue growth on a like‐for‐like basis (i.e. organic growth)
Growth on a like‐for‐like basis (constant scope and exchange rates) is calculated excluding the effects of exchange rate fluctuations and changes to the consolidation scope over the reporting period.
Exchange rate impacts are measured by converting the revenue of the period with the average exchange rate from the previous period.
Scope impact is measured excluding the revenue generated during the period for acquisitions, and excluding the revenue generated in the previous period for disposals and transfers, in order to ensure the new scope is identical to the previous period.
This indicator enables users to identify the group’s intrinsic business performance over the reporting period.
Growth of activity in Q1 2024


